Chartist 10% Off
Chartist クーポン&セール – 10%割引【2026 · 検証済み】
Verified by Lensey
デフォルトの価格はUSDです、購入ページに入る際にJPYに切り替えることができます
🧑💼 追加サポート
ベンダーからの返答がない場合や、注文/技術的な問題がある場合は、当社がサポートします。
🛡️ 安全で信頼できる
ご注文は公式サイトで完了し、データは最新のセキュリティ基準で保護されます。
⚡迅速な配信(ソフトウェア/SaaS)
ソフトウェア/SaaS のアクティベーション情報は通常 5 分以内に配信されます。
2006 年からの実績 — Trustpilot 評価 4.9/5。
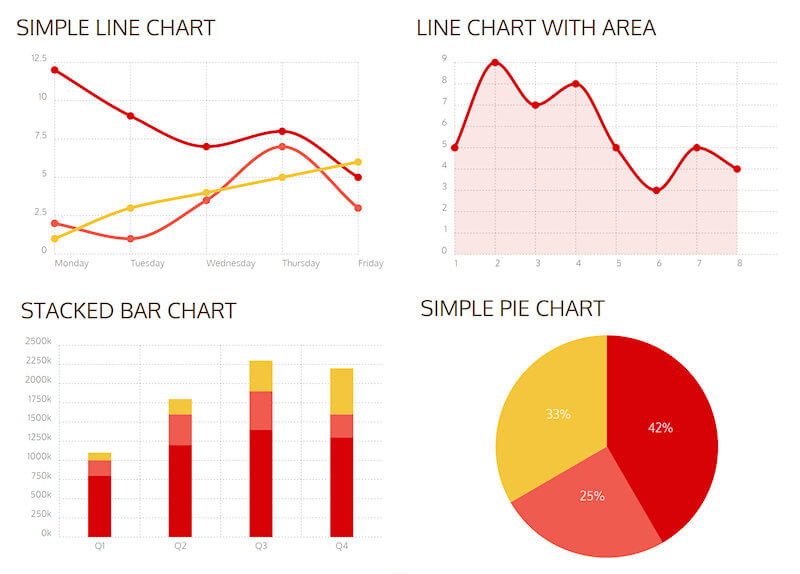
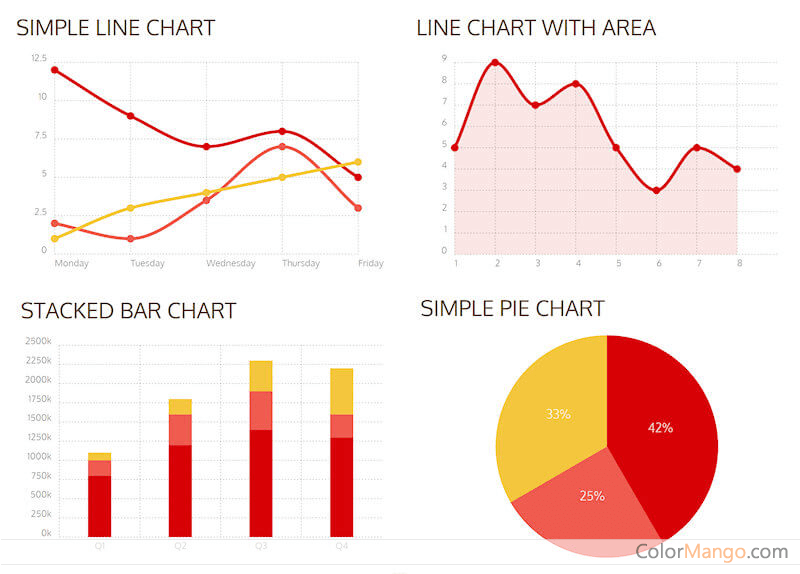
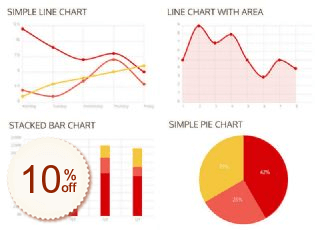
chartist Javascriptライブラリを使用して、SVGを使用してスケーラブルで見栄えの良いチャートを作成します
この拡張モジュールは chartist Javascript ライブラリを使用して、SVG を使用してスケーラブルで見栄えの良いチャートを作成します。これは自己完結型のスクリプトなので、外部サービスには依存しません。グラフのデータは、さまざまなデータソース (MYSQL、CSV、JSON、MDB) からロードできます。
主な機能
• エリアチャート、バーチャート、カラムチャート、ラインチャート、スタックチャート、ドーナツチャート、円グラフ
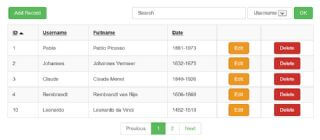
• MySQL、CSV、MS アクセス (MDB)、または JSON からデータをロードします
• 多数のスタイルオプションあなたのコメントは私たちにとって非常に重要です。最初のコメントを残してください!
カスタマーレビューを書くカスタマー Q&A
- ❓ Chartist のプロモコードが使えないのはなぜですか?
- ❓ ColorMangoに掲載されているChartistのプロモコードは本物ですか?
- Chartistのプロモコードはすべて公式ルートから入手しています。
ブランドとの直接提携、公式ニュースレターの確認、編集チームによる手動検証を経て掲載しています。
すべての割引はColorMango編集チームによって厳重に審査・テストされ、安全で信頼できるものです。
💡 安心してご利用いただき、公式割引をお楽しみください。
- ❓ Chartistのプロモコードはどのくらいの頻度で更新されますか?
- 過去1年間で、Chartistのプロモコードは0回更新されました。
このページに表示されているコードは最新かつ検証済みの最高割引(ユーザー報告による無効回数:0回)なので、安心してご利用いただけます。公式および提携チャネルを継続的に監視し、新しいプロモーションを発見次第、すぐに更新します。
- ❓ Chartistはブラックフライデー/サイバーマンデーに割引がありましたか?
- Black Friday/Cyber Monday 2025 の期間中、Chartistの追加割引はありませんでした。
🕵️♀️ ColorMangoは、ブラックフライデー/サイバーマンデー期間中のChartistのセールを定期的に監視し、新しい割引情報が確認され次第すぐに更新しています。
- ❓ Chartistの返金はどのように行われますか?
- ほとんどのソフトウェアは7〜30日以内であれば無条件返金保証を提供しています。製品の公式返金ポリシーを確認するか、ColorMangoサポートにご連絡ください。返金手続き完了まで丁寧にサポートいたします。
質問お問い合わせ / 注文サポート人気のソフトウェア・毎日が低価格
© 2006-2026 ColorMango.com, Inc.
All Rights Reserved.
© 2006-2026 ColorMango.com, Inc. All Rights Reserved.